Case study
- Client
- Cartel
- Industry
- Design Intent UI
- Project type
- Operations dashboard redesign
- Duration
- Jan 2025 to Mar 2025
- My role
- Product design, frontend architecture, data visualization
- Summary
- Rebuilt core workflows and reduced response times across the operations stack while improving reliability and visibility.
At a glance
- Primary KPI
- Time to resolution
- Secondary KPIs
- Approval lead time, refund latency, success rate
- Tech
- Laravel, React, TypeScript, Tailwind, Recharts
Context and goals
Problem: Fragmented tools, slow incident response, limited visibility into payment health.
Goals: Unify monitoring and actions, surface anomalies in real time, speed up approvals and refunds, make reporting self serve.
Users and jobs to be done
- Ops lead
- Monitor payment health and triage incidents.
- Finance analyst
- Reconcile payouts and track fees.
- Support agent
- Resolve disputes and process refunds.
- Executive
- Review KPIs and growth trends.
Scope
- In scope
- KPIs, anomaly alerts, approvals, refunds, disputes, reconciliation, reports.
- Out of scope
- Core ledger rewrite, new payment methods, mobile apps.
Research and insights
Inputs: Stakeholder interviews, shadowing, ticket audits, telemetry.
Key insights: Operators rely on timeline context, bulk actions are critical, latency spikes cluster by provider.
Information architecture
- Core entities
- Payments, charges, refunds, disputes, payouts, providers
- Key attributes
- Status, amount, currency, method, provider, region, risk score, timestamps
- Actions
- Approve, refund, dispute, escalate, export
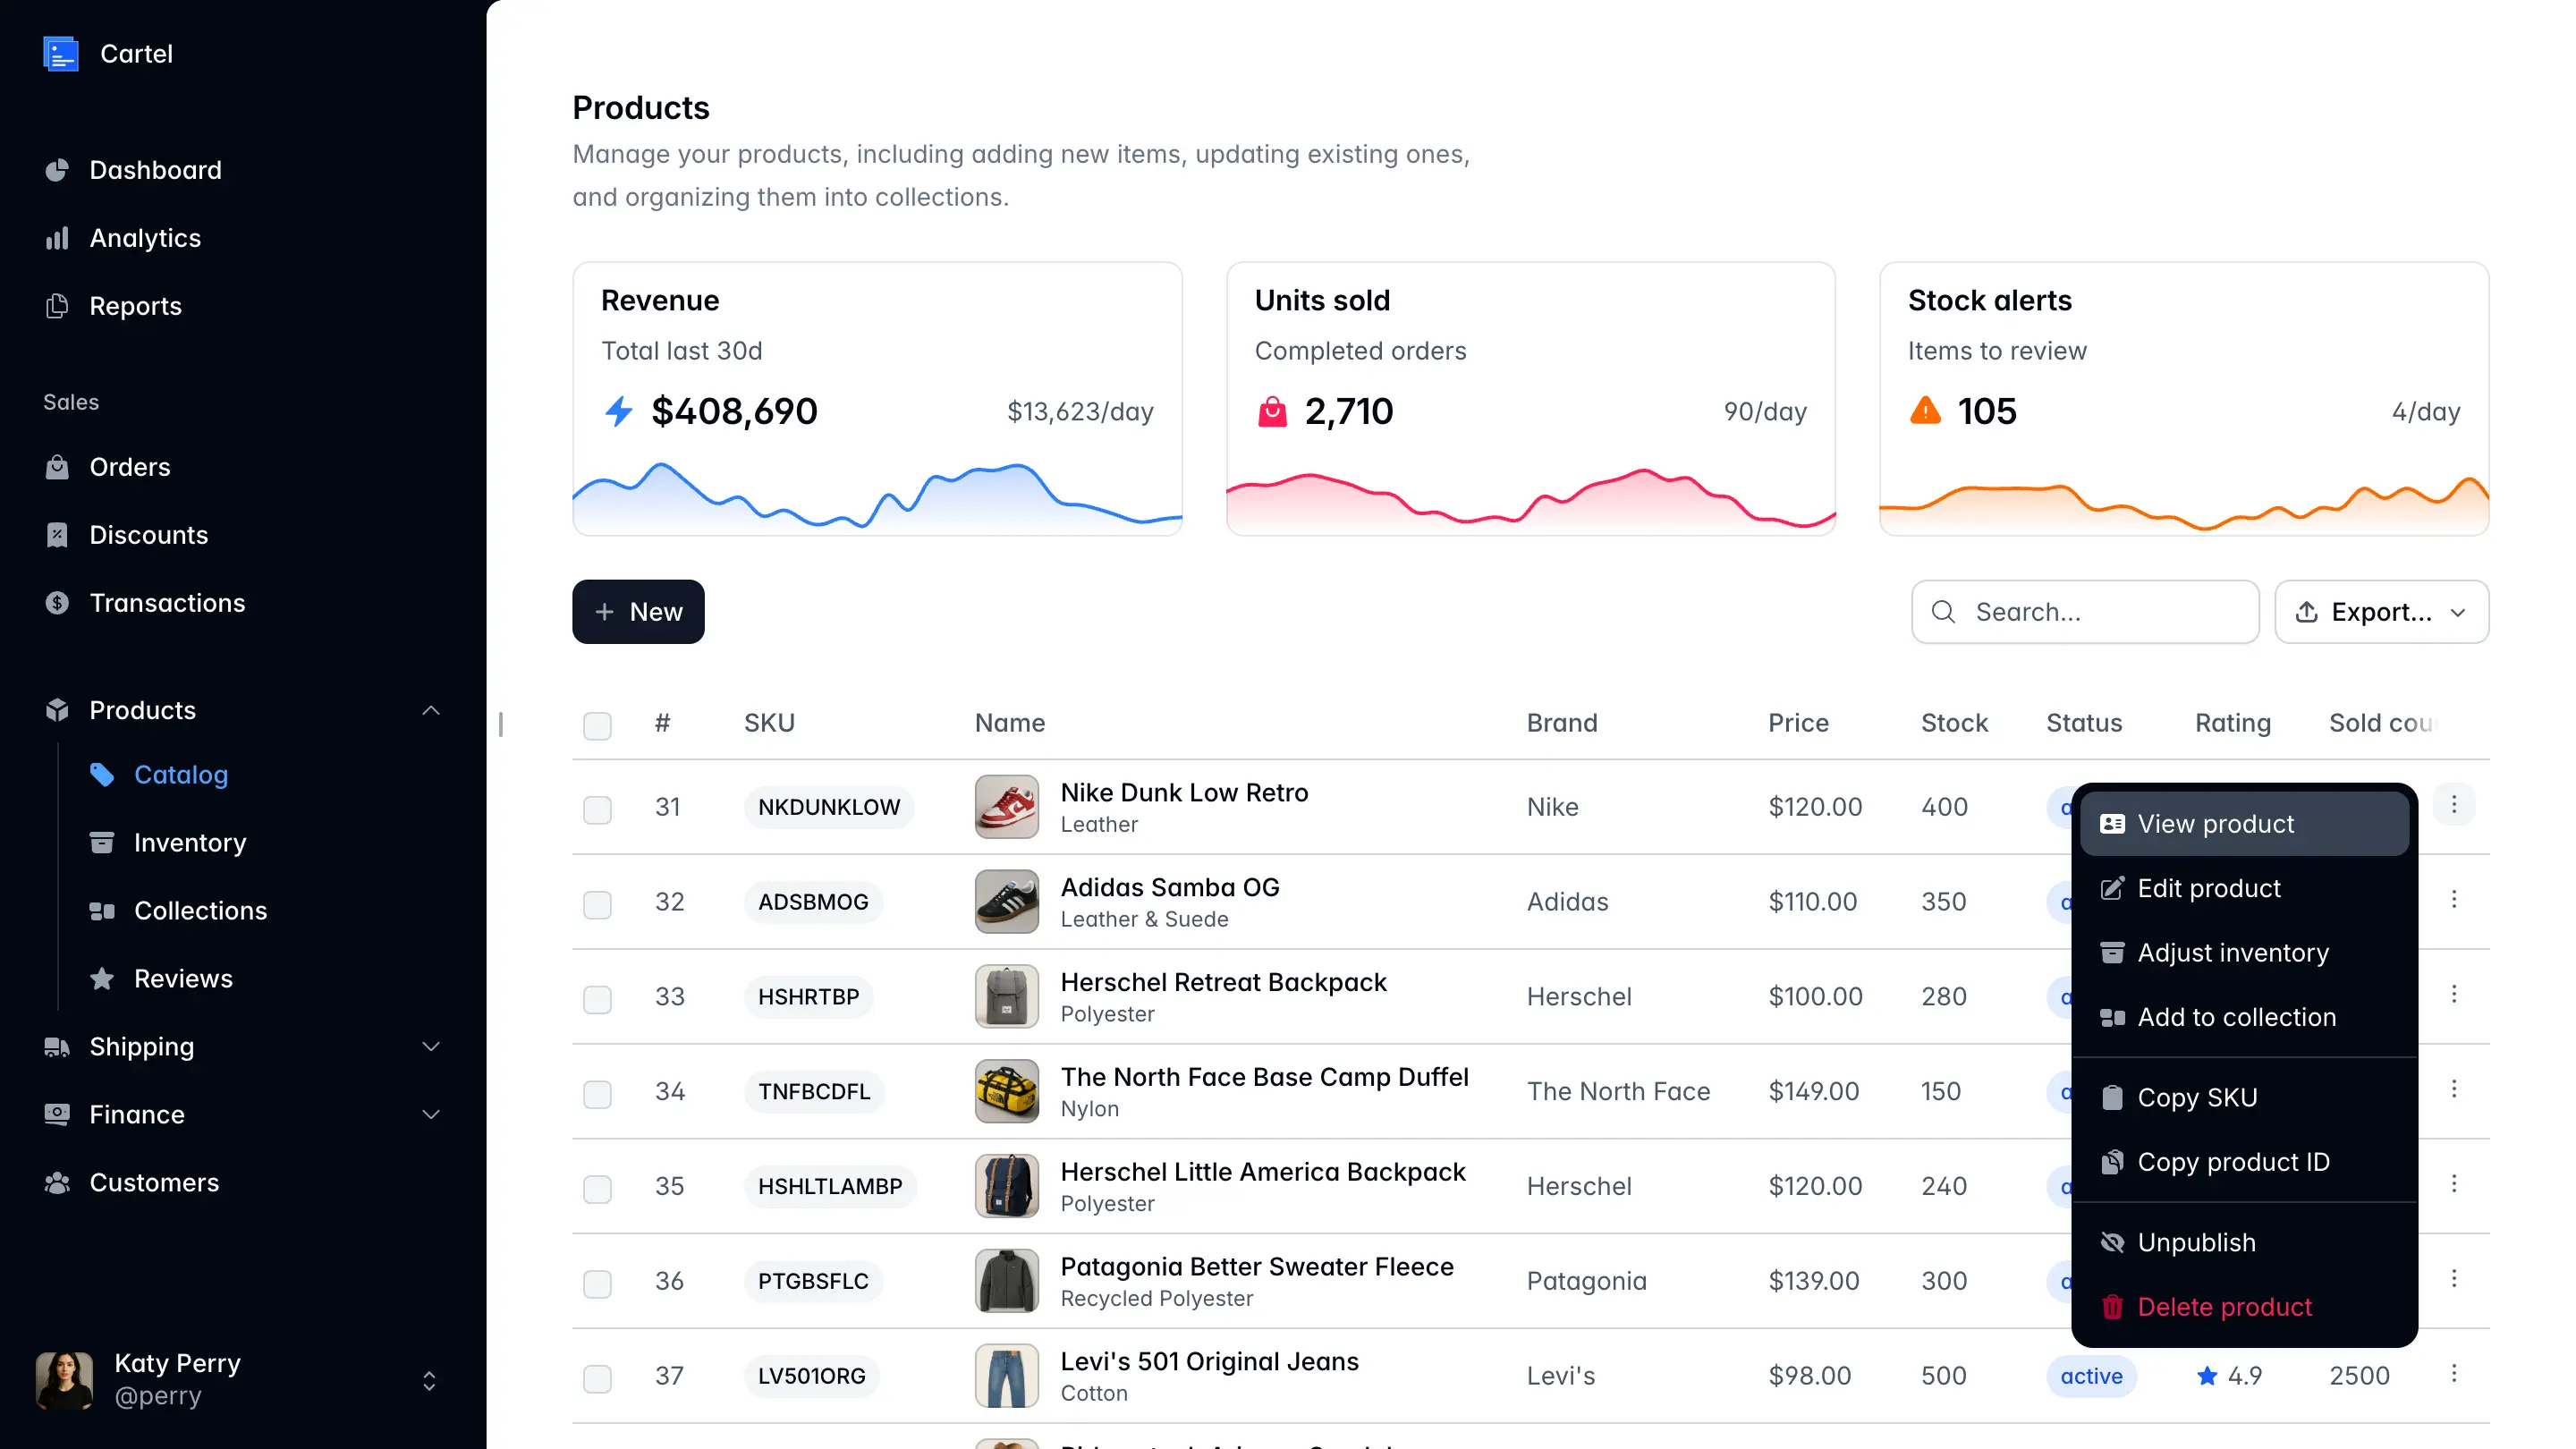
- Overview
- KPI cards, sparkline trends, recent incidents
- Health
- Provider status, failure breakdowns, latency percentiles
- Operations
- Search, filters, bulk actions for approvals, refunds, disputes
- Finance
- Payout status, fee summaries, reconciliation tools
- Reports
- Scheduled and ad hoc with CSV and XLSX export
System design
Data model: Payments, charges, refunds, disputes, payouts, providers.
Pipelines and APIs: Ingest events, normalize, aggregate, store, index, expose read models for dashboards and write models with audit logs.
Design system
- Tokens
- Color, spacing, radius, elevation
- Components
- Card, Table, Toolbar, Filter, Chart, Badge, Toast, Dialog
- Patterns
- Bulk actions, progressive disclosure, optimistic updates
Key flows
Incident triage: Alert to root cause to mitigation with provider filters and timeline.
Refund workflow: Search, validate risk signals, process, notify, log.
Visualization
- KPIs
- Net revenue, success rate, chargebacks, pending refunds
- Charts
- Area for revenue, bar for failures by reason, line for latency
- Time grouping
- 30 min for today or yesterday, daily for weeks, monthly for months
Performance, accessibility, security
Performance: Column virtualization, query caching, incremental hydration.
Accessibility and security: React Aria primitives, focus management, RBAC by role, scoped API tokens, audit trails, PII redaction.
Implementation highlights
- Stack
- Laravel v12, Inertia React, Vite, TypeScript
- Charts
- Recharts with custom tooltip and legend
- Tables
- Server search, facets, pagination, CSV and XLSX export
- Theming
- Token driven light and dark
Results
- Time to resolution
- 38 percent faster
- Refund latency
- 42 percent faster
- Chargeback rate
- 12 percent lower
- Support handle time
- 27 percent lower
Outcome:
Timeline and team
Phases: Discovery, design, implementation, hardening, launch.
Team: Product designer, frontend engineer, backend engineer, data engineer, QA, PM.
Testimonials
Ops lead: The new dashboard cut our morning triage time in half.
Finance analyst: Reconciliation is now a one click task.